Debugging Guide
In this section, we'll cover some debugging suggestions that can help track down the source of issues in an app.
Tracing Broken and Orphaned Blocks
Pictorus is constantly re-evaluating your diagram to see what it can generate code for, and what it cannot. You can highlight issues by clicking the blue exclamation mark in the bottom-right. It will highlight any Broken (blocks with bad parameters or missing inputs) in red, and any Orphaned blocks (blocks affected by a Broken block) in orange.
In the example above, we could see that the Product block was broken, since multiplication requires two inputs. By attaching another signal to it, the issue is resolved and the App compiles. By removing an input to the Sum block, new issues are reported and we can quickly identify them.
Error Messages
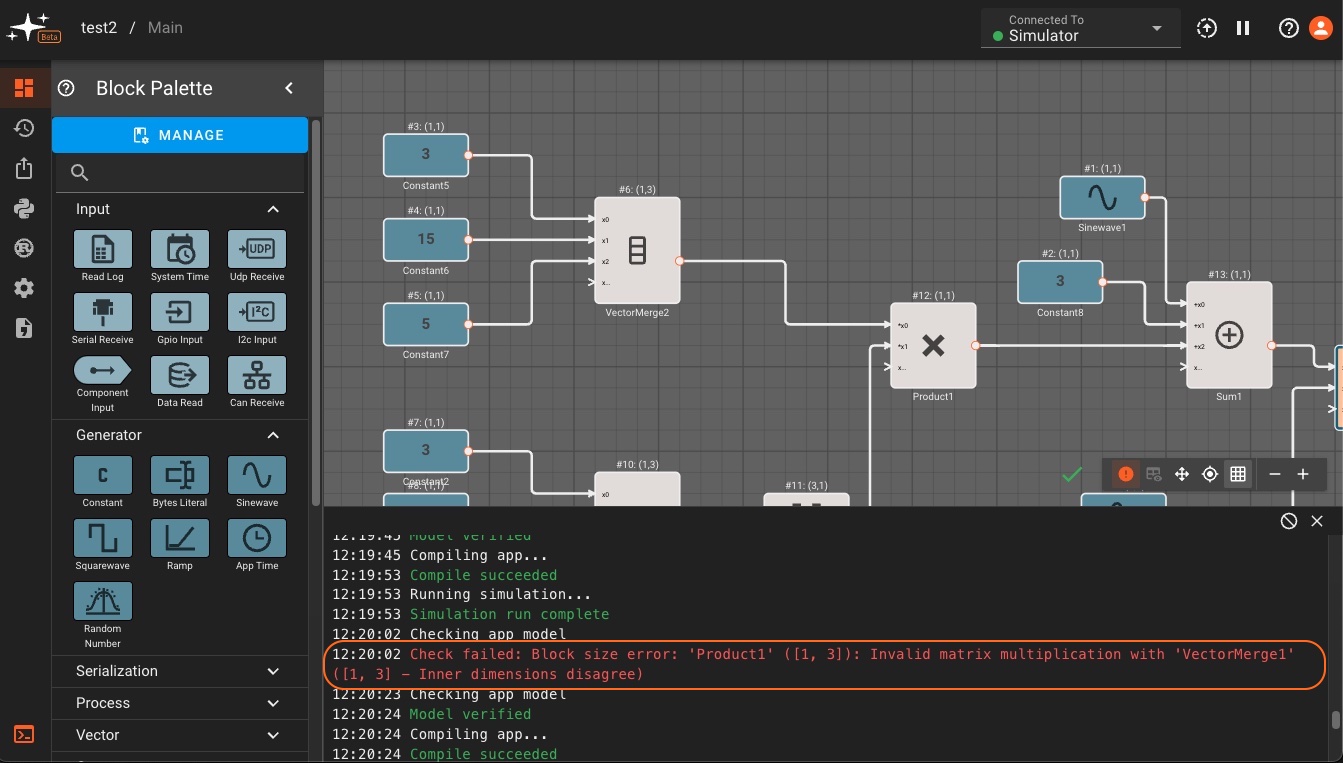
Certain blocks also have specific checks that run before an app can be compiled. If there is an issue that causes these checks to fail, a build error message will appear in red at the top of the canvas. We can see an example of this below, where a matrix multiplication block sees an error in the sizes of its input matrices. Errors will usually show the block name and size to help identify the source of the issue. Resizing the second input with a Vector Reshape block clears the error in this example.
Build errors will appear in the debugging terminal rather than as a banner in the canvas when the terminal is viewable. Below we see that the matrix sizing error is also logged in the debug terminal.
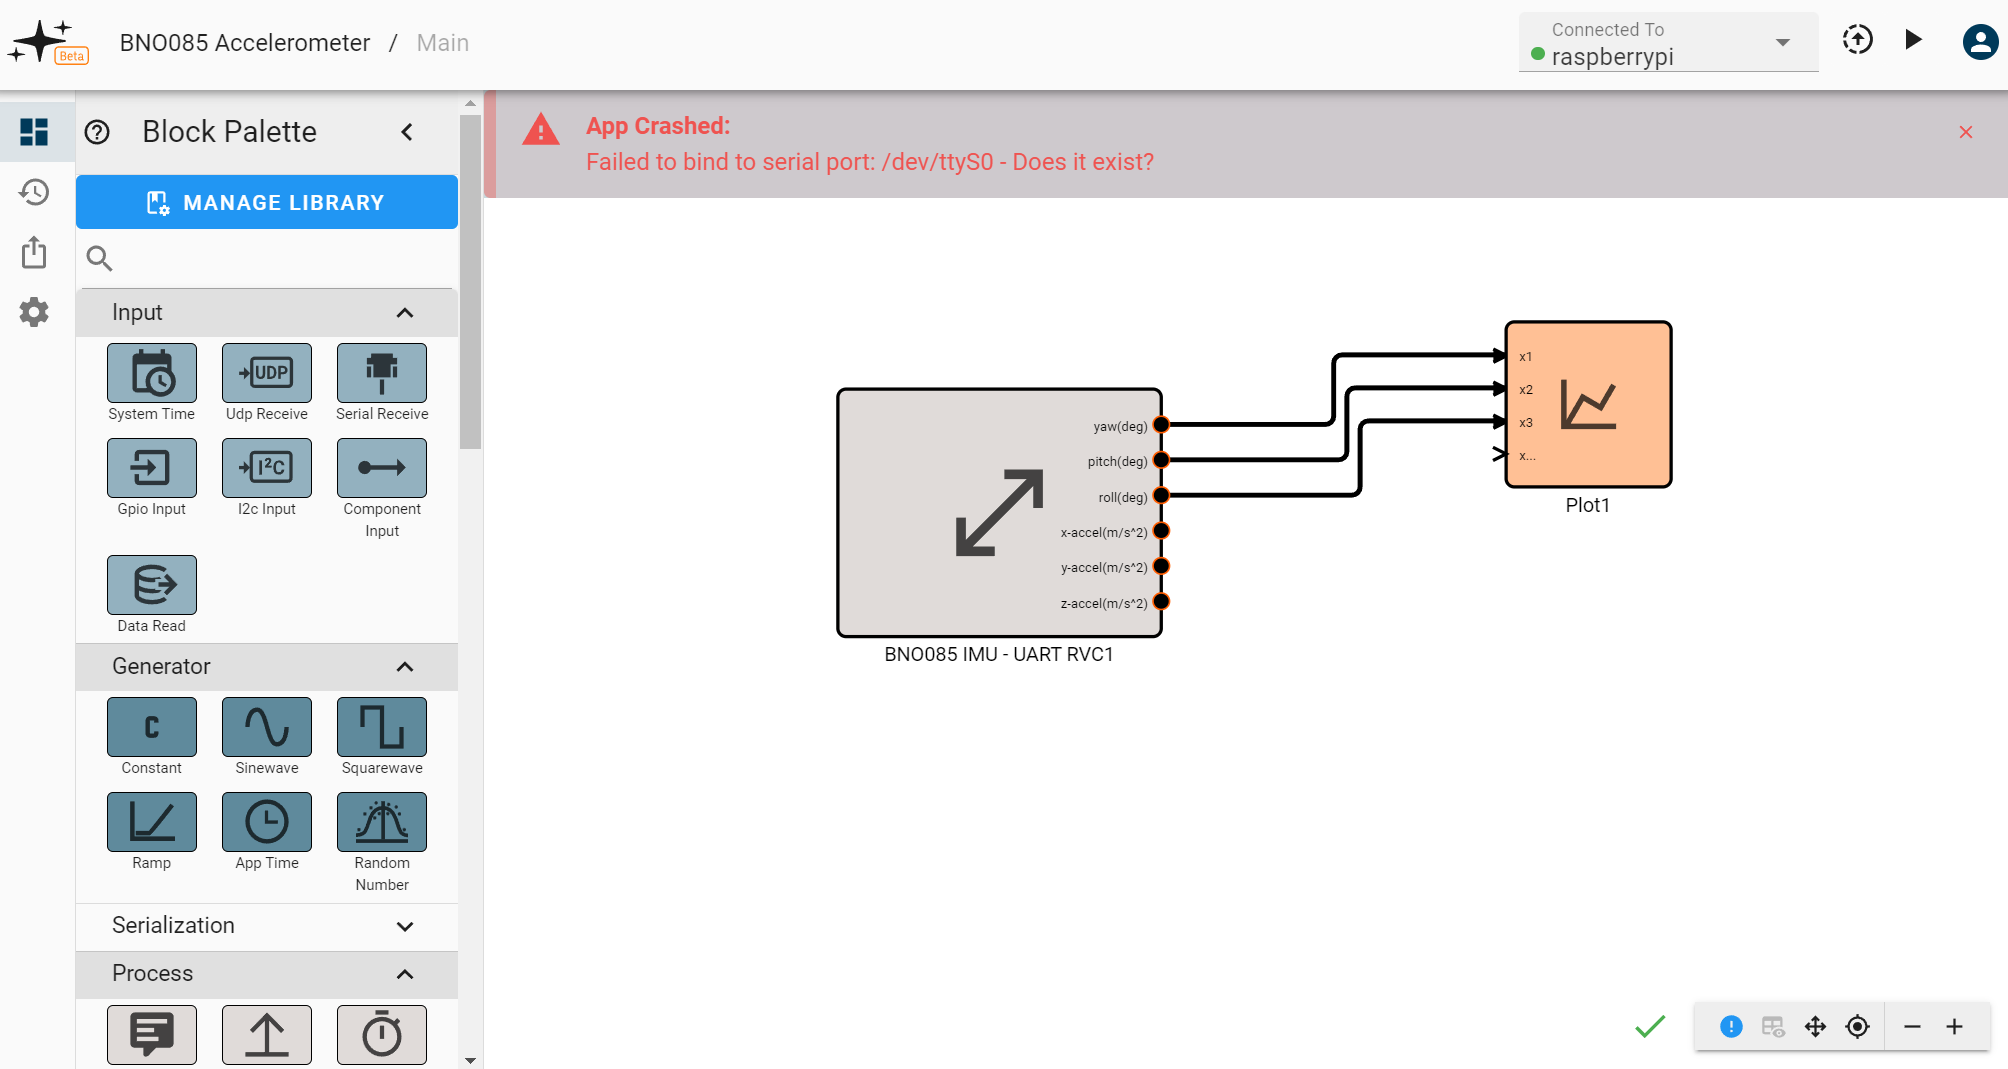
Errors that happen when an app is running will also appear at the top of the canvas and in the debug. Some examples of these errors include a device going offline or a protocol being configured incorrectly. For instance, here we see an error for a nonexistent serial port on a Raspberry Pi:
Sizing and Execution Order Hints
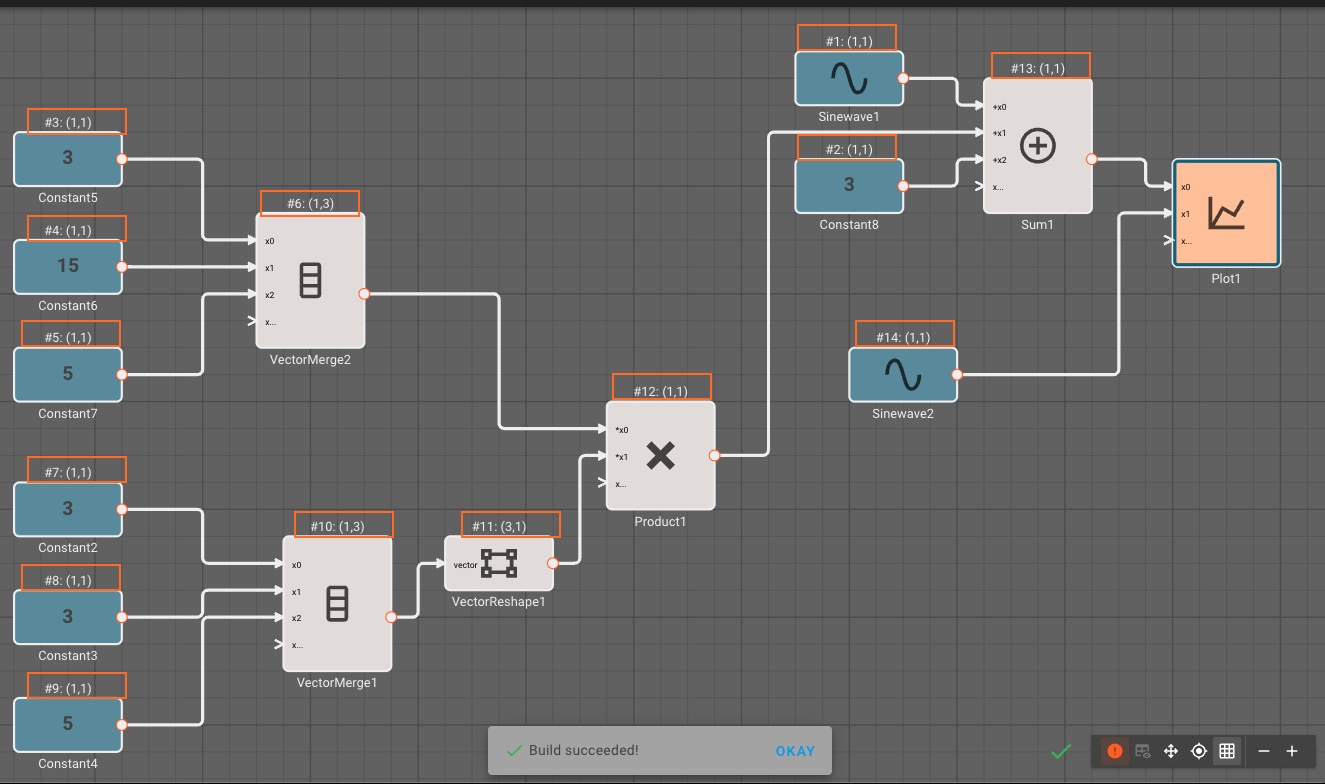
When an app is successfully compiled, Pictorus can also display information about the flow of data in an app. Specifically, users can see the order of execution of blocks as well as the size of the output for each block. After the app builds successfully, click the blue exclamation mark (!) in the bottom left of the UI to display block flow information. The execution order (#n) and size (m,n) will appear above each block, as outlined in orange below:
Debugging Apps on a Device
General hardware debugging guidance
Before digging into our on-hardware debugging features, here is a quick reminder to consider some general hardware debugging steps when an app does not run as expected:
-
Check your wiring. Double check that your pins, ports, and connections match those configured in your diagram.
-
Check the documentation. Devices often have nuanced bootup/configuration sequences, or odd timing steps that must be executed precisely before the device will communicate properly.
-
Check all required protocols are enabled. Some protocols on some devices (like I2C on RaspberryPi) have to be manually enabled within the OS. Check if that is the case.
-
Does it work with a trusted Python script (or any other tool)? Many device manufacturers publish simple scripts online that can verify a device is working properly.
-
When in doubt, power-cycle! The old reliable medicine for a misbehaving computer.
For devices which are online but behaving oddly, consider the following software debugging steps:
Viewing App Logs
After SSHing into your device. You should be able to see logs from the app and device manager using journalctl.
- To see all logs:
journalctl -u pictorus - To see recent log output in real time
journalctl -u pictorus -f
These logs may reveal some telling errors, especially if the app is crashing or failing to initialize properly.
Running the app manually
You can also run an app outside of the device manager and manually pass in flags to make debugging easier.
- First make sure that the app is not running to avoid any resource conflicts.
- You can do this by pausing the app from the UI, or by running
sudo systemctl stop pictorusto kill the device manager and any associated processes. If you kill the app manager, make sure to start it when you're finished:sudo systemctl start pictorus.
- You can do this by pausing the app from the UI, or by running
- You can now run the installed app manually by running
sudo /root/.pictorus/device_manager/apps/pictorus_managed_app
Debug logging
You can add the flag LOG_LEVEL=debug to print out extra information, including the value of each block at every time step. Warning: This generates a lot of verbose output, and can affect the performance of apps.
sudo LOG_LEVEL=debug /root/.pictorus/device_manager/apps/pictorus_managed_app
Recording data to a CSV
You can have the app output block values to a CSV file by setting APP_DATA_LOG_RATE_HZ=<rate_hz>, where the specified number is the maximum rate in Hz that the data will be logged. Data will be output to a file named diagram_output.csv in your current directory.
sudo APP_DATA_LOG_RATE_HZ=1 /root/.pictorus/device_manager/apps/pictorus_managed_app- This will only record data from blocks connected to a diagram output (such as plots or network/file IO blocks), so you will need to connect any blocks you're interested in to a
Plotblock.
Overriding block parameters
You can override parameters for any block in the diagram using environment variables. This can be done by locating the block ID (found in the lower right-hand corner of a block's setting panel),
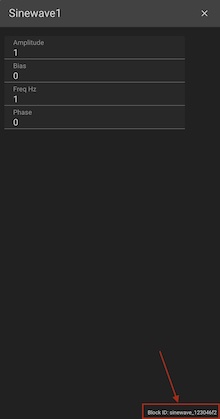
and then appending the name of the param you want to override. For instance: if I wanted to set the Amplitude of a block with ID = sinewave_123 to 42, I would add the flag SINEWAVE_123_AMPLITUDE=42 (note this must be all caps!) to the run command.
sudo SINEWAVE_123_AMPLITUDE=42 /root/.pictorus/device_manager/apps/pictorus_managed_app
Environment variables
There are other environment variables your App will respond to. Below is a list of them:
- APP_DATA_LOG_RATE_HZ (default = 0): Sets the rate, in hertz (times per second), at which output data is logged to file. If the rate is 0 (as it is by default), no data output file will be created. An App cannot publish faster than its fundamental update rate (specified in browser).
- APP_RUN_PATH (default = ""): The run path sets the local path where any assets generated by the app (i.e. the data log) will be stored.
- APP_TRANSMIT_ENABLED (default = True): Enables/Disables any communication with hardware and protocols. When running in Simulation mode, for example, this prevents apps from attempting to communicate with non-existent hardware.
- APP_PUBLISH_SOCKET (default = ""): Sets the UDP socket for communication with the Pictorus Device Manager.
- LOG_LEVEL (default =
INFO): Sets the logging level. Options are currentlyINFOandDEBUG. Info level shows very little logging, but will capture any major failure messages. Debug level dumps every single block’s value at every single time step. Use with caution!