Interface Tour
In this section we'll do a quick run through of the interface features you'll encounter when you first open Pictorus in the browser.
Account Page
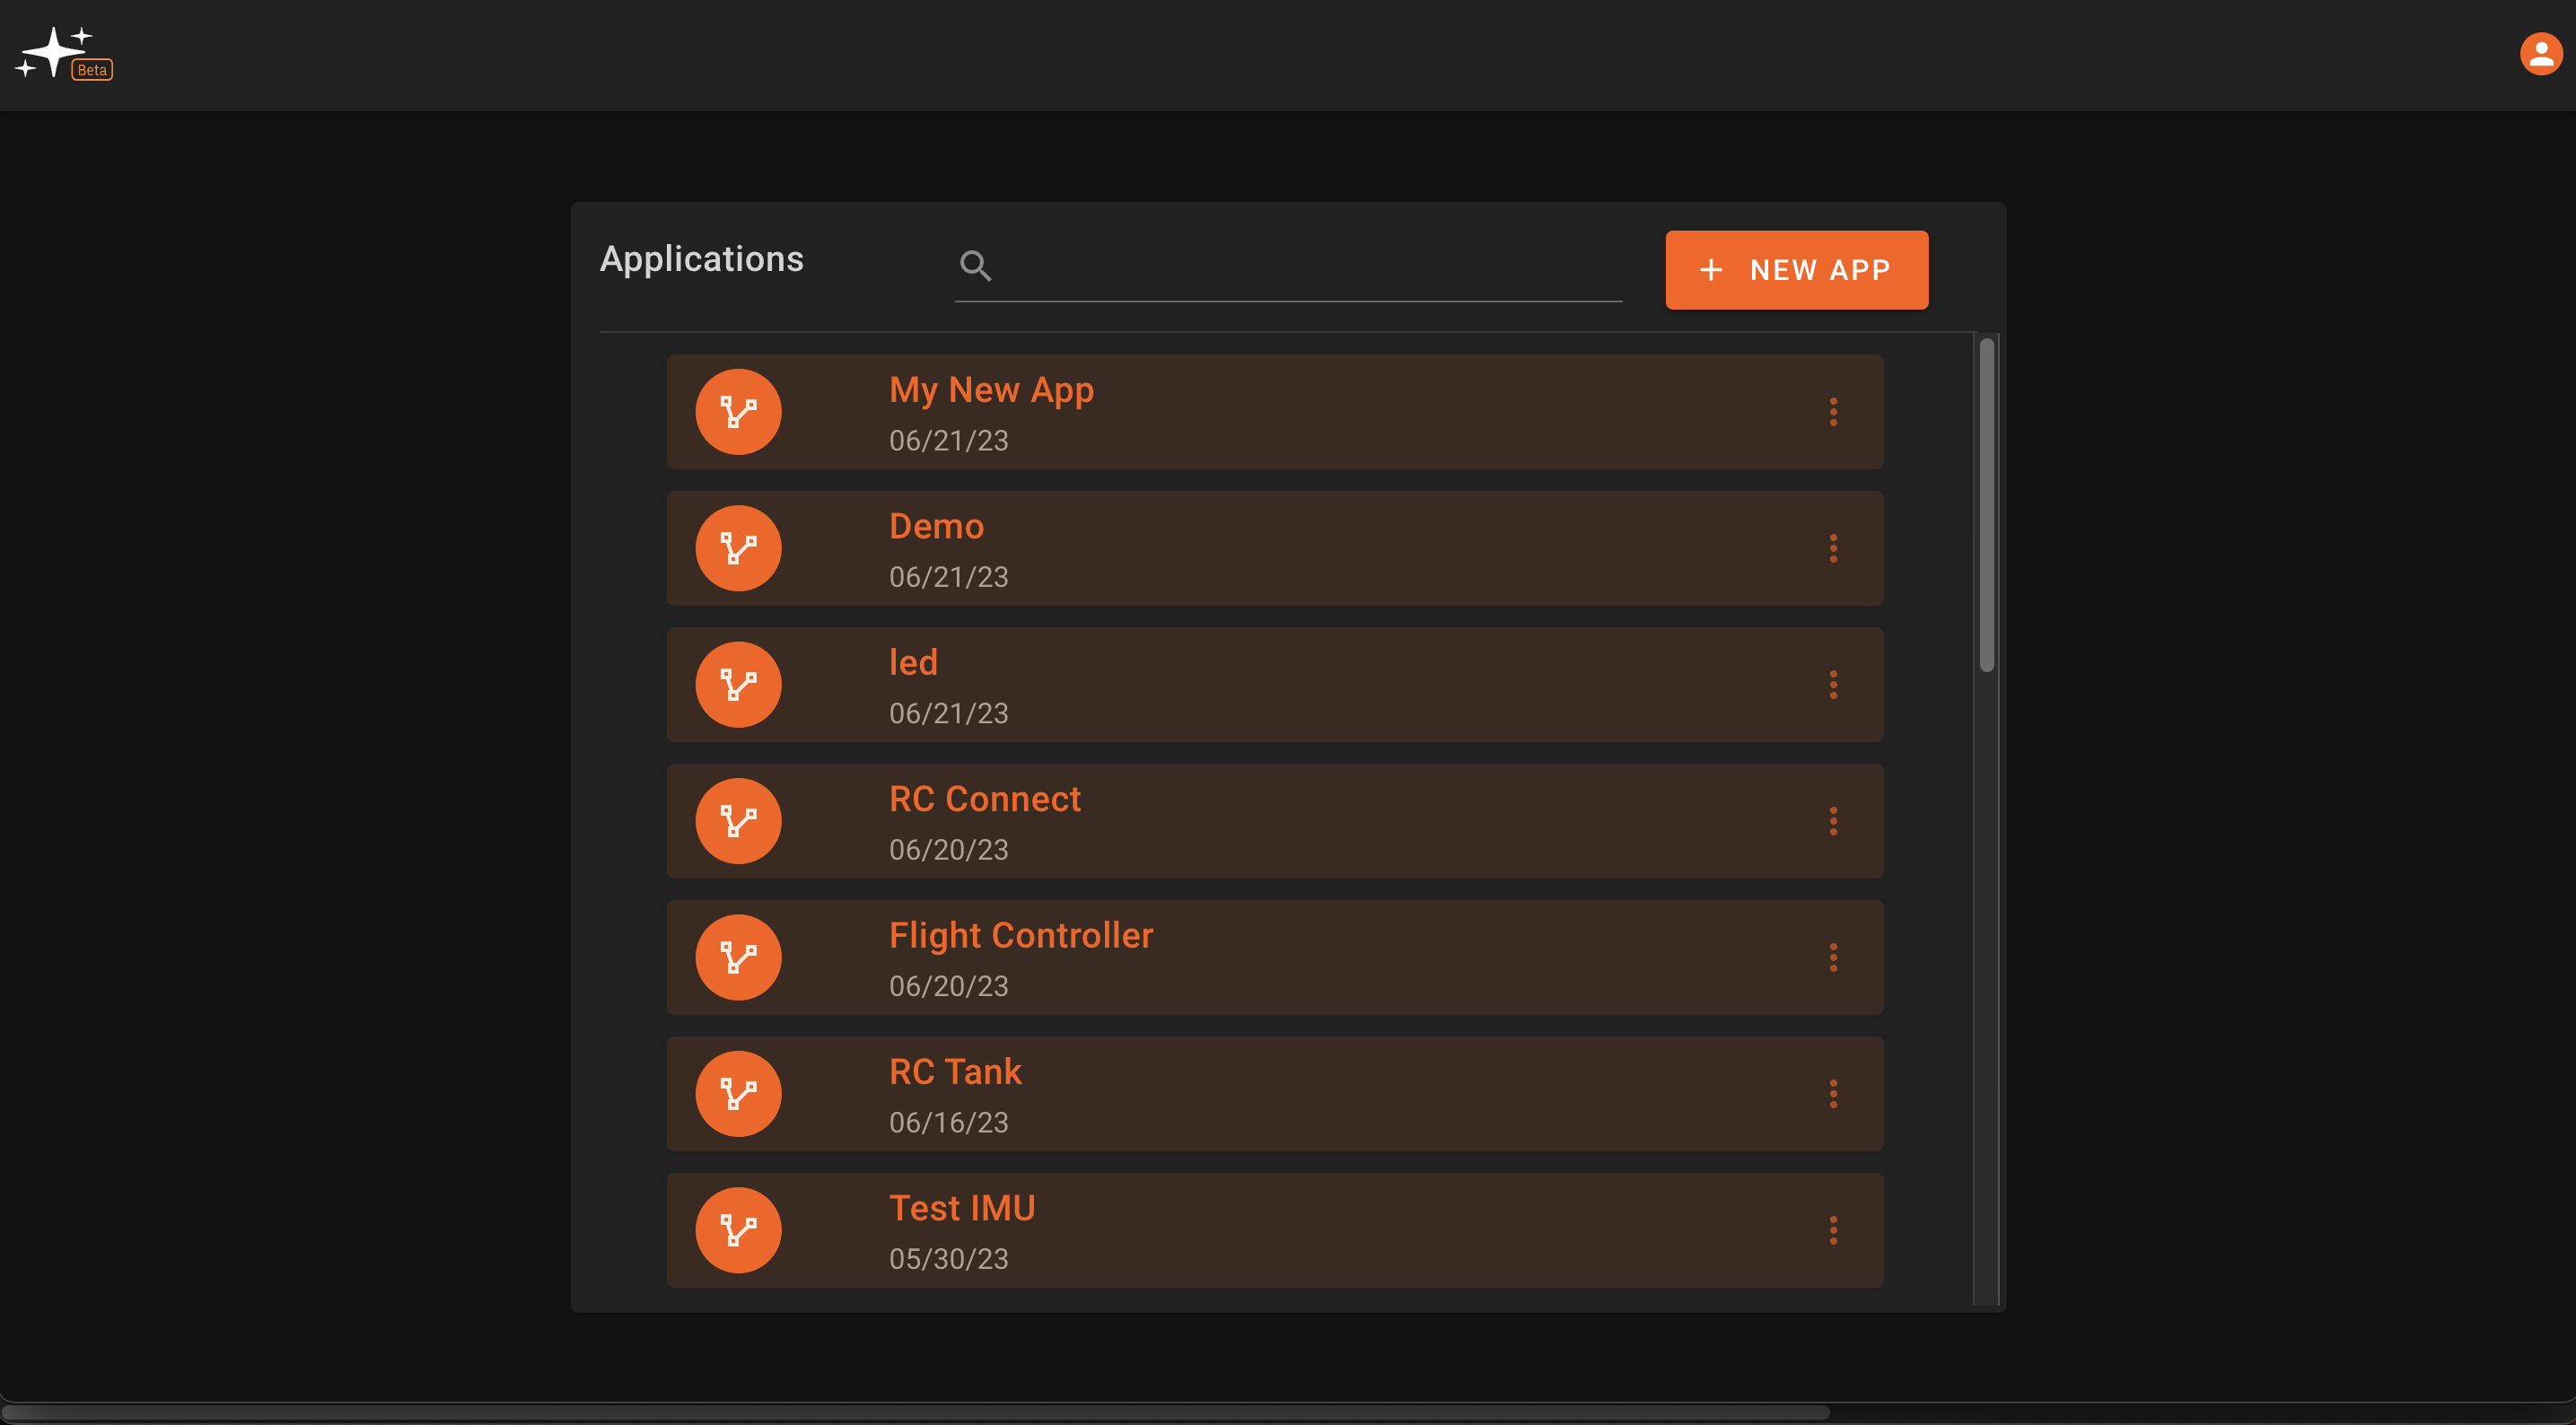
When you first log in to Pictorus, you'll arrive at your account page, which contains a list of all of the apps associated with your account. Apps can be accesssed, deleted, renamed, and copied from this page, by clicking on the three dots on the rightside of the app row. For now, you'll see a few demo apps that are automatically added to your new account. You'll have the option to start a tour when you first open the app as well.
App Editor
After clicking into an app or creating a new app, you will be directed to its Main state. For more information on app States in Pictorus, navigate to the Concepts > State Machines section of the docs.
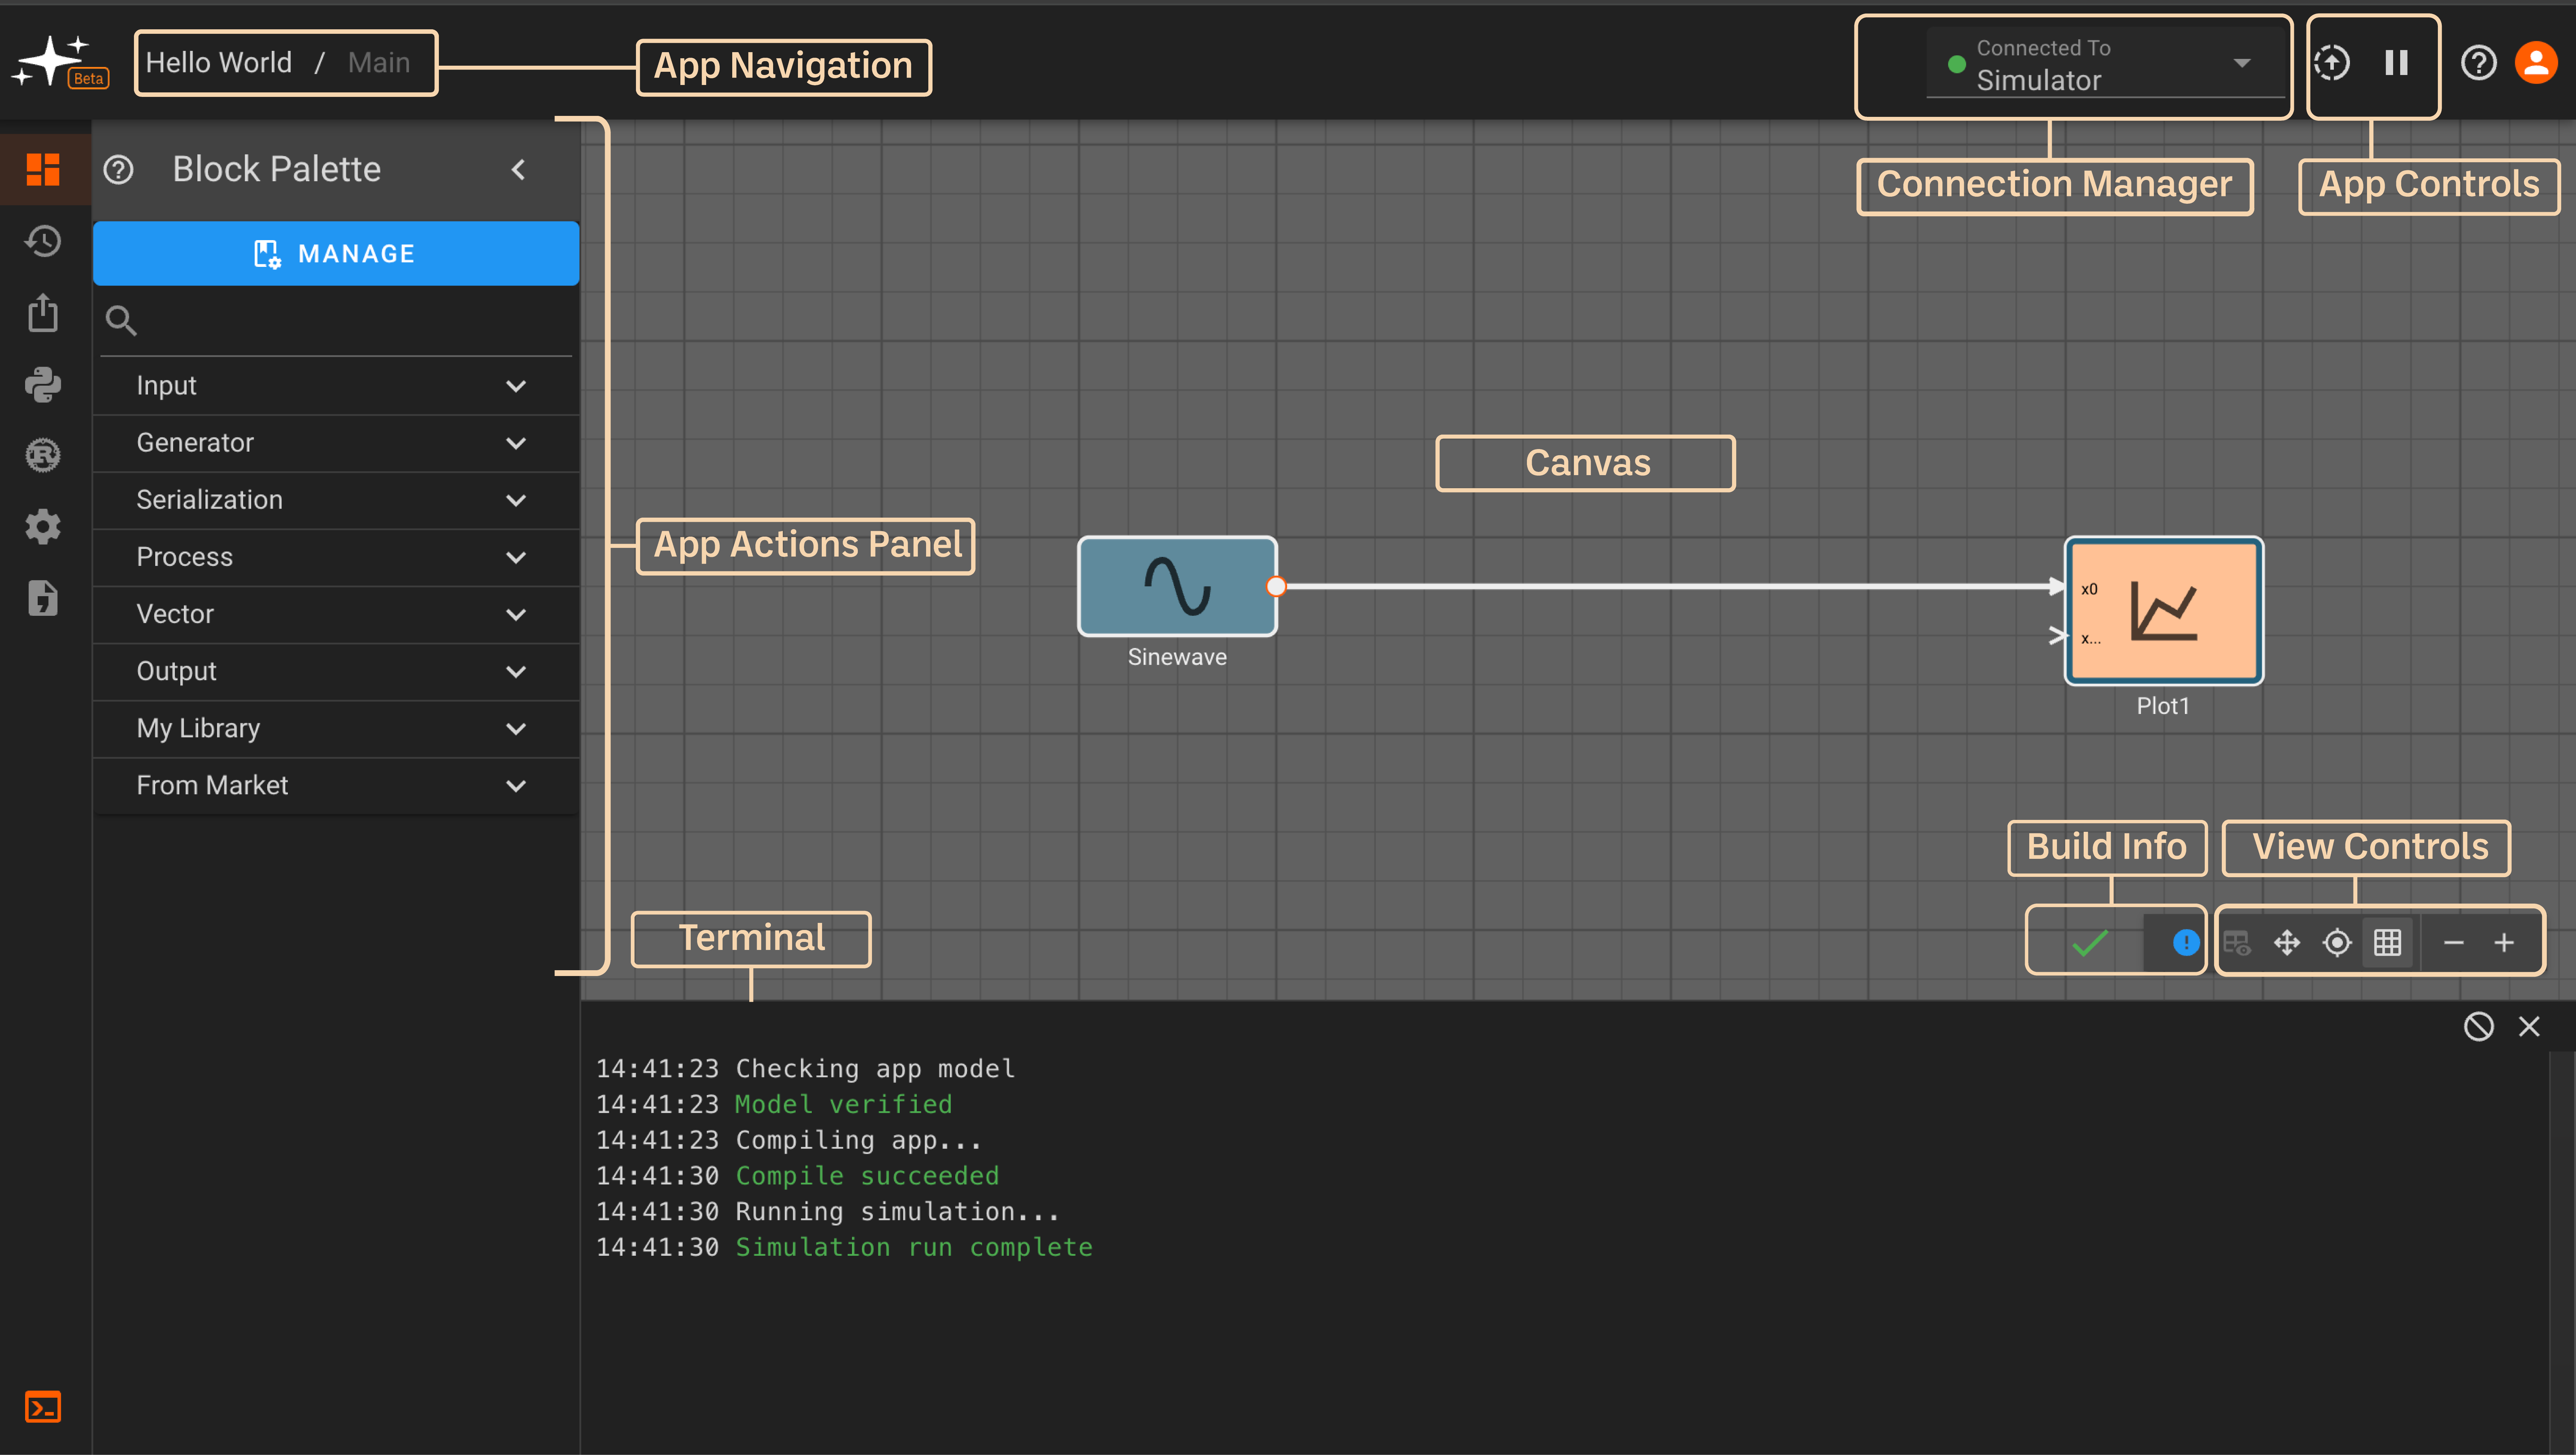
The interface is divided into a few sections:
-
App Navigation: Navigate across levels of hierarchy in your app. If you only have one state and no nested components in your app, you'll see
AppName / Mainhere. The current app page is greyed out while others can be navigated to by clicking on the page's name. -
Connection Manager: Click the dropdown arrow to select a device to connect to. Devices online will show a green dot and others will be greyed out. An app can also be run in simulation mode by selecting "Simulator". You will be connected to "Simulator" by default on app startup.
-
App Controls: Build, deploy, start, and stop apps with these two buttons. The up arrow builds an app when in simulation mode or deploys to a device if one is connected. The play/pause button starts/stops an app.
-
App Actions Panel: This is where you'll find app editing actions. The panel is divided into five submenus -
Block Palette,Version History,Export App,Scripts,Custom Blocks,App Settings, andStatic Assets.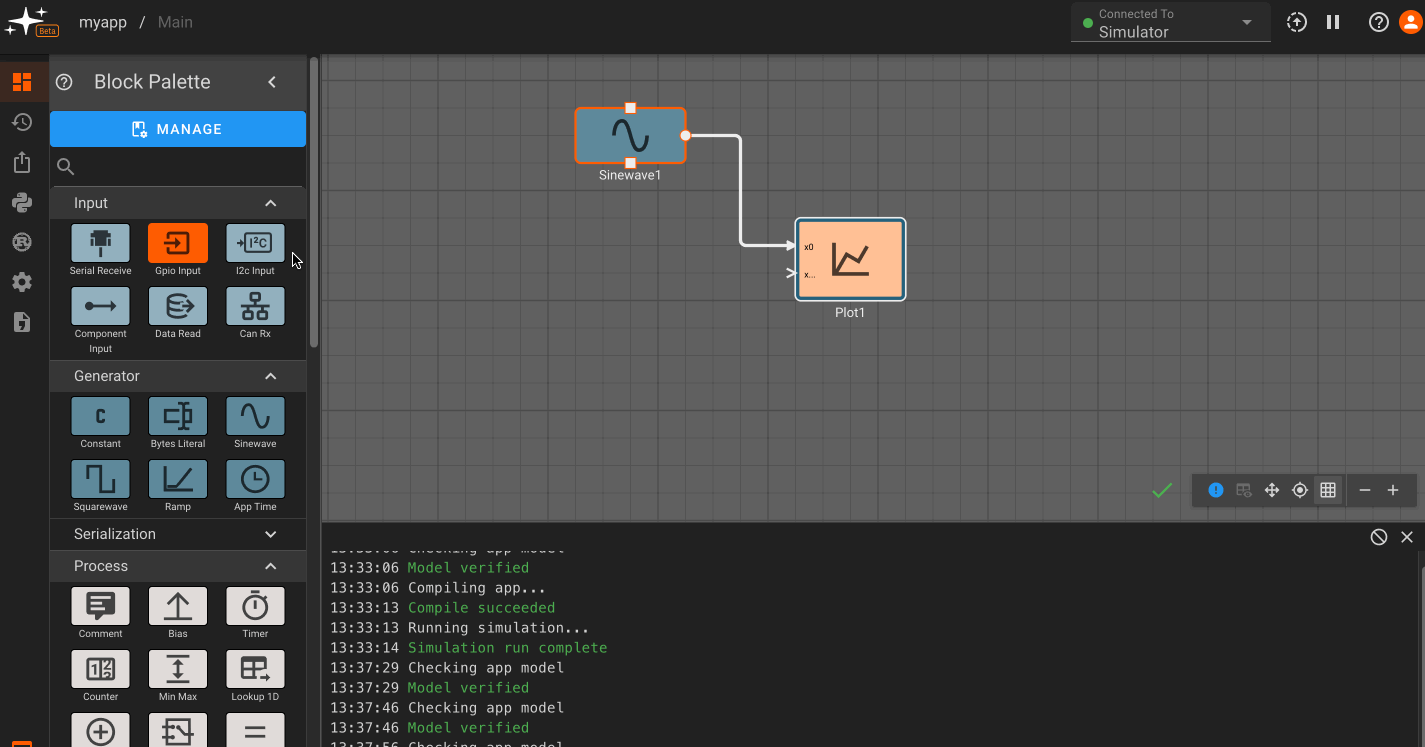
Block Palette: Contains standard and a user's library blocks which can be dragged onto the canvas.Version History: Save a current app version and/or restore a previously saved versionExport App: Export the code generated for a specific appScripts: Declare variables and perform pre-run calculations with Python scriptsCustom Blocks: Create and edit custom blocks in RustApp Settings: Change the app name, update rate, and build output settingsStatic Assets: Upload an asset to be used in your app (currently supports CAN database files).
-
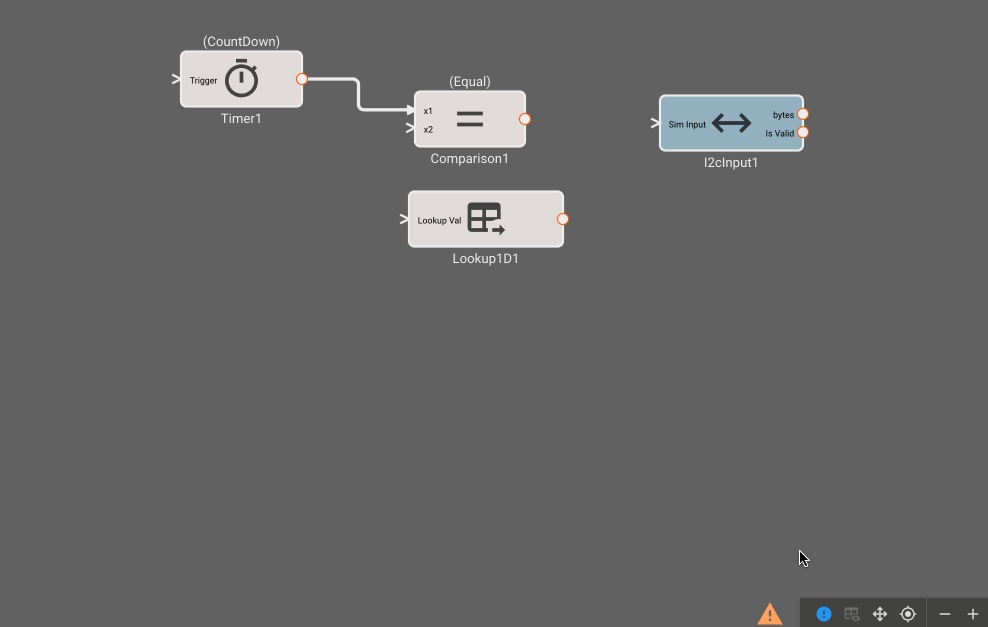
Canvas: This is the editing workspace where you can drag and connect blocks and inspect outputs
-
Debug Console: Here you can view detailed information about your app's build, compile, and runtime actions. Toggle the debug console with the terminal icon at the bottom of the left panel.
-
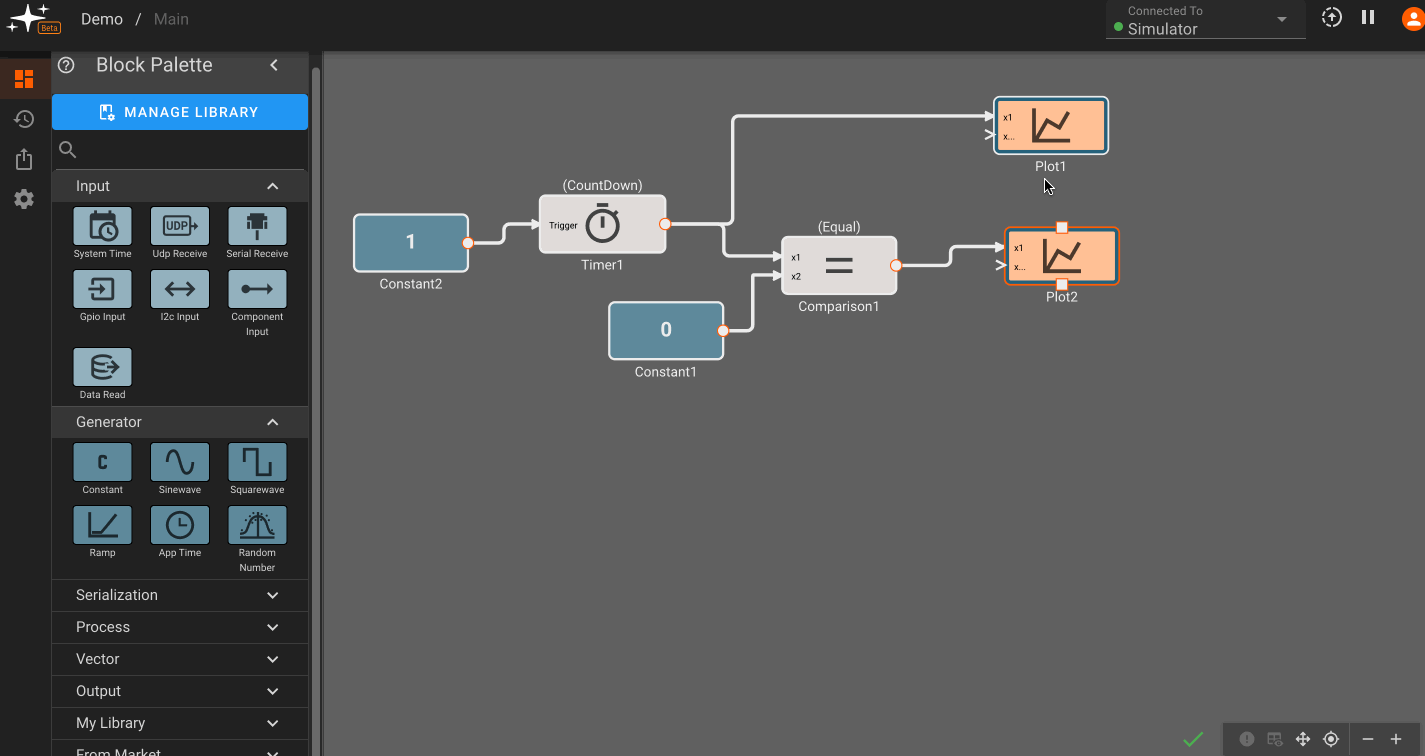
Build Info: The green checkmark indicates that a build is up-to-date and there are no issues. Alternatively, you may see a warning sign or red 'x' indicating that there may be an issue. The encircled '!' can be clicked to show issues with the current build:
-
View Controls: The leftmost option here allows for plot toggling on/off. The next two options allow for panning and centering a diagram. The grid icon toggles the grid on/off, and the rightmost controls allow for zooming in and out of the canvas. #TODO: fix this