Histogram Plot Block
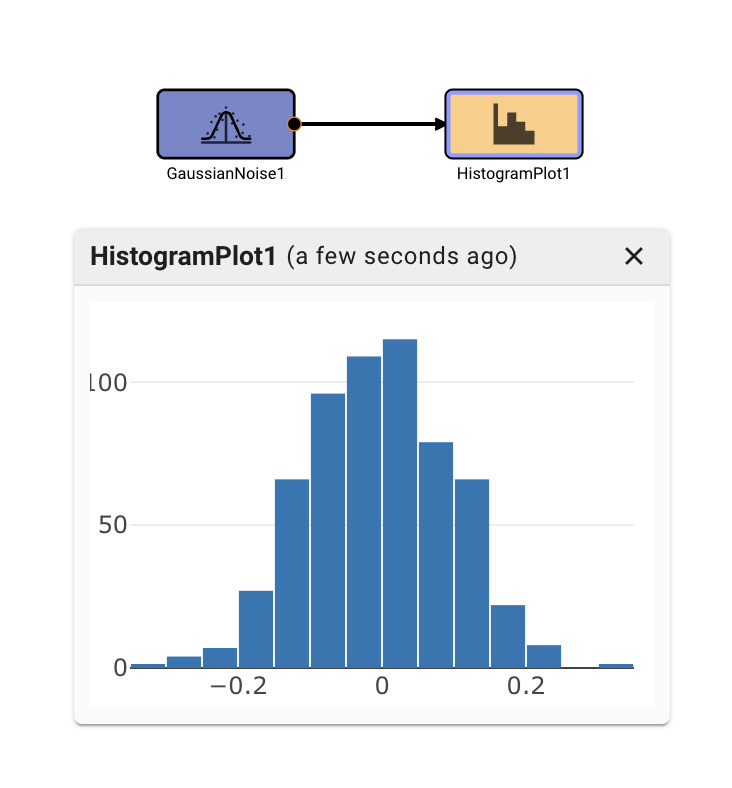
The Histogram block plots vertical bins representing the number of samples (Y axis) falling within the ranges specified by the X-axis.
Currently, bin count and ranges are automatically generated, and chosen so that this number is comparable to the typical number of samples in a bin.
Parameters
None
Examples